I was recently asked to expand on my post on making interactive maps to show how to produce a leaflet map with an inset map and nice lat/lon labels of suitable quality to be used in publication. Here’s a very quick example of how that might be done. The astute will notice many similarities with my last post on mapping with leaflet.
Step 1: make some data
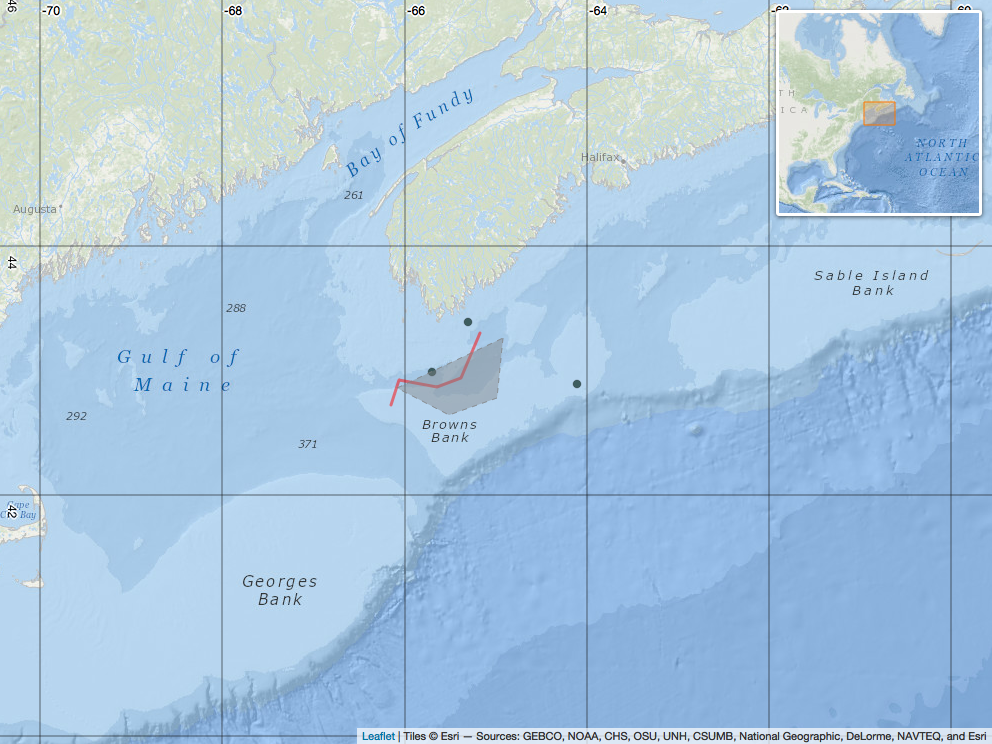
Here’s some test data to plot. These structures could, of course, be replaced by real data.
# make a simple track line
lin = data.frame(lon = c(-65.17536, -65.37423, -65.64541, -66.06122, -66.15161),
                 lat = c(43.30837, 42.94679, 42.87448, 42.92871, 42.72985))

# make a few points
pts = data.frame(lon = c(-65.3, -65.7, -64.1),
                 lat = c(43.4, 43, 42.9))

# build a polygon (in this case the 'Roseway Basin Area To Be Avoided')
ply = data.frame(lon = c(-64.916667, -64.983333, -65.516667, -66.083333),
                 lat = c(43.266667, 42.783333, 42.65, 42.866667))
Step 2: build map
Now let’s build the map. This is achieved with the leaflet() function, and a series of pipes (%>%) to sequentially add more features. Hopefully the comments adequately describe each feature. The whole thing is stored as the variable map.
# required libraries
library(leaflet, quietly = T, warn.conflicts = F)
library(mapview, quietly = T, warn.conflicts = F)

# start basemap (note the argument to hide the zoom buttons)
map <- leaflet(options = leafletOptions(zoomControl = FALSE)) %>%

  # add ocean basemap
  addProviderTiles(providers$Esri.OceanBasemap) %>%

  # focus map in a certain area / zoom level
  setView(lng = -65, lat = 43, zoom = 7) %>%

  # add inset map
  addMiniMap(
    tiles = providers$Esri.OceanBasemap,
    position = 'topright',
    width = 200, height = 200,
    toggleDisplay = FALSE) %>%

  # add graticules with nice labels (recommended for static plot)
  addSimpleGraticule(interval = 2) %>%

  # add graticules from a NOAA webserver (recommended for interactive plot)
  # addWMSTiles(
  #   "https://gis.ngdc.noaa.gov/arcgis/services/graticule/MapServer/WMSServer/",
  #   layers = c("1-degree grid", "5-degree grid"),
  #   options = WMSTileOptions(format = "image/png8", transparent = TRUE),
  #   attribution = NULL,group = 'Graticules') %>%

  # add points (as circle markers)
  addCircleMarkers(data = pts, ~lon, ~lat,
                   weight = 0.5,
                   col = 'black',
                   fillColor = 'darkslategrey',
                   radius = 4,
                   fillOpacity = 0.9,
                   stroke = T,
                   label = ~paste0('Point at: ',
                                   as.character(round(lat,3)), ', ',
                                   as.character(round(lon,3))),
                   group = 'Points') %>%

  # add lines
  addPolylines(data = lin, ~lon, ~lat,
               weight = 3,
               color = 'red',
               popup = 'This is a line!',
               smoothFactor = 3,
               group = 'Lines') %>%

  # add polygons
  addPolygons(data=ply, lng=~lon, lat=~lat,
              weight = 1,
              color = 'grey',
              fillColor = 'grey',
              fill = T,
              fillOpacity = 0.25,
              stroke = T,
              dashArray = c(5,5),
              smoothFactor = 3,
              options = pathOptions(clickable = F),
              group = 'Polygons')

# show map
# map

# save map as static image
# mapshot(map, file = 'leaflet_map.png')
Here’s the saved map: